


The price is right (even when it’s low)
A framework for commodity crop prices in agriculture

Welcome to Topsoil – a monthly newsletter with frameworks to help you make sense of agriculture, at just the right depth.
Before we get into our topic today, I want to share a recent podcast appearance. I joined Tim and Tyler on the Modern Acre podcast to talk about math in agriculture (which I promise is a lot more fun than it sounds!). If you haven’t listened to the Modern Acre podcast yet, I recommend it. Interesting guests across the agriculture industry stop in and share their thoughts — I learn something new every episode!
I want to wish you a joyous holiday season and happy new year. Thank you for spending some of your valuable time reading Topsoil in 2024 – it means a great deal to me. More to come in 2025!
Now onto today’s topic. You can’t read too many articles about agriculture right now without getting hit with a clear message: prices for agricultural commodities are low.
Today, we’re going to focus on prices for commodity crops – crops produced in massive volumes, to uniform standards, that are sold on global exchanges – like corn and soybeans.
So just how low are prices right now?

Both corn and soybeans are roughly 45% below their all time highs. Prices for many other crop commodities are also trending lower this year.
After weather, prices are the #2 thing that farmers check daily (if not more frequently) because of the impact on farm profitability. So why are prices low today and what actually moves this important number?
Let’s dig in!
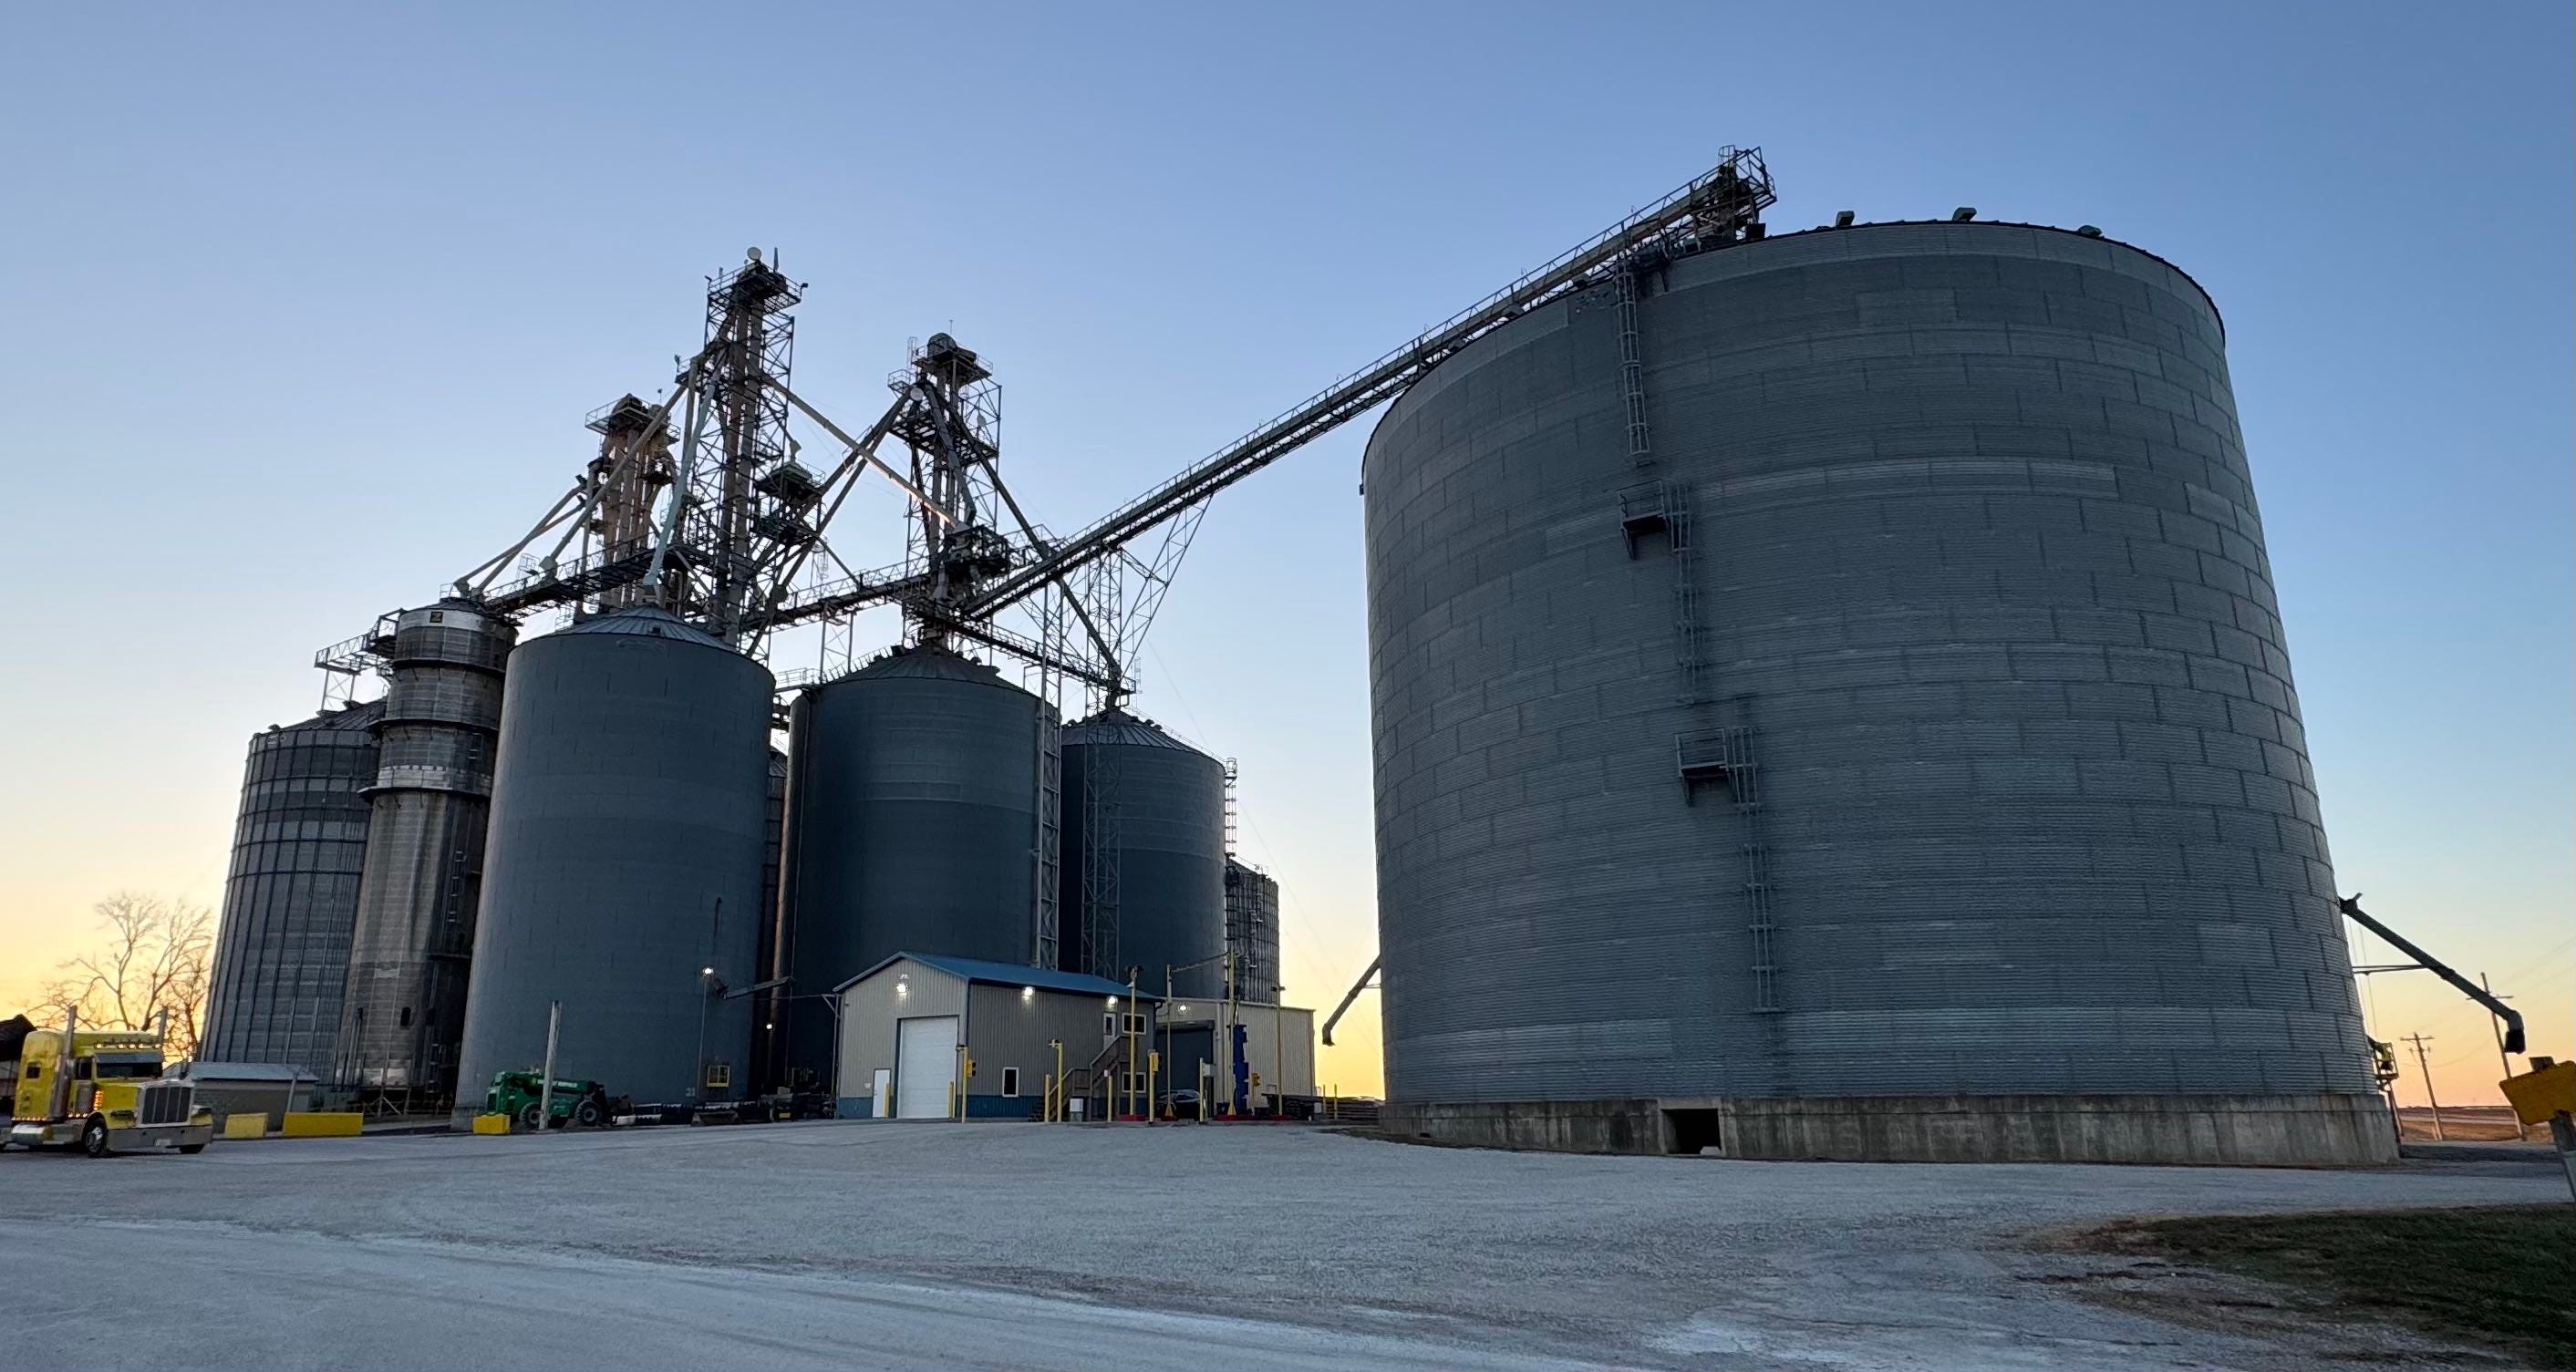
Local grain to global markets
Farmers typically sell their grain to a local grain elevator. There may be a few elevators in the area that each quote a slightly different price. (Side note: technically soybeans are “oilseeds”, but I’m going to refer to “grains” generally so you don’t have to hear me say “grains and oilseeds” a million times).
The local cash price that a farmer receives is based on two parts:
Local Cash Price = Futures Price + Basis
You can think of the futures price as the global price for that commodity. Grain futures contracts are sold on the Chicago Board of Trade, similar to how a stock is traded on the New York Stock Exchange. Like stocks, futures prices change constantly due to a huge number of buyers and sellers around the world trading with every bit of new information.
Basis is the difference between the futures price and the local price at a specific elevator. It reflects storage and transportation costs (remember we’re talking about bulky, physical goods). Local supply and demand also impact basis, like if there is a nearby ethanol plant.
Basis can be negative or positive. Typically for commodity grains in regions where a lot is grown, basis is negative. This means that the local cash price is lower than the futures price you see online.

For example, as of today, the ADM Corn Processing facility in Cedar Rapids, Iowa will buy corn for $4.35 per bushel. The basis is -$0.11 and the futures price is $4.46.
Basis is important, but we can see that the futures price has a much bigger influence on the total dollars that a farmer receives. Let’s now take a look at the futures price.
Supply and Demand
To understand commodity crop pricing, we’re going to borrow one of the most popular frameworks from economics: supply and demand.
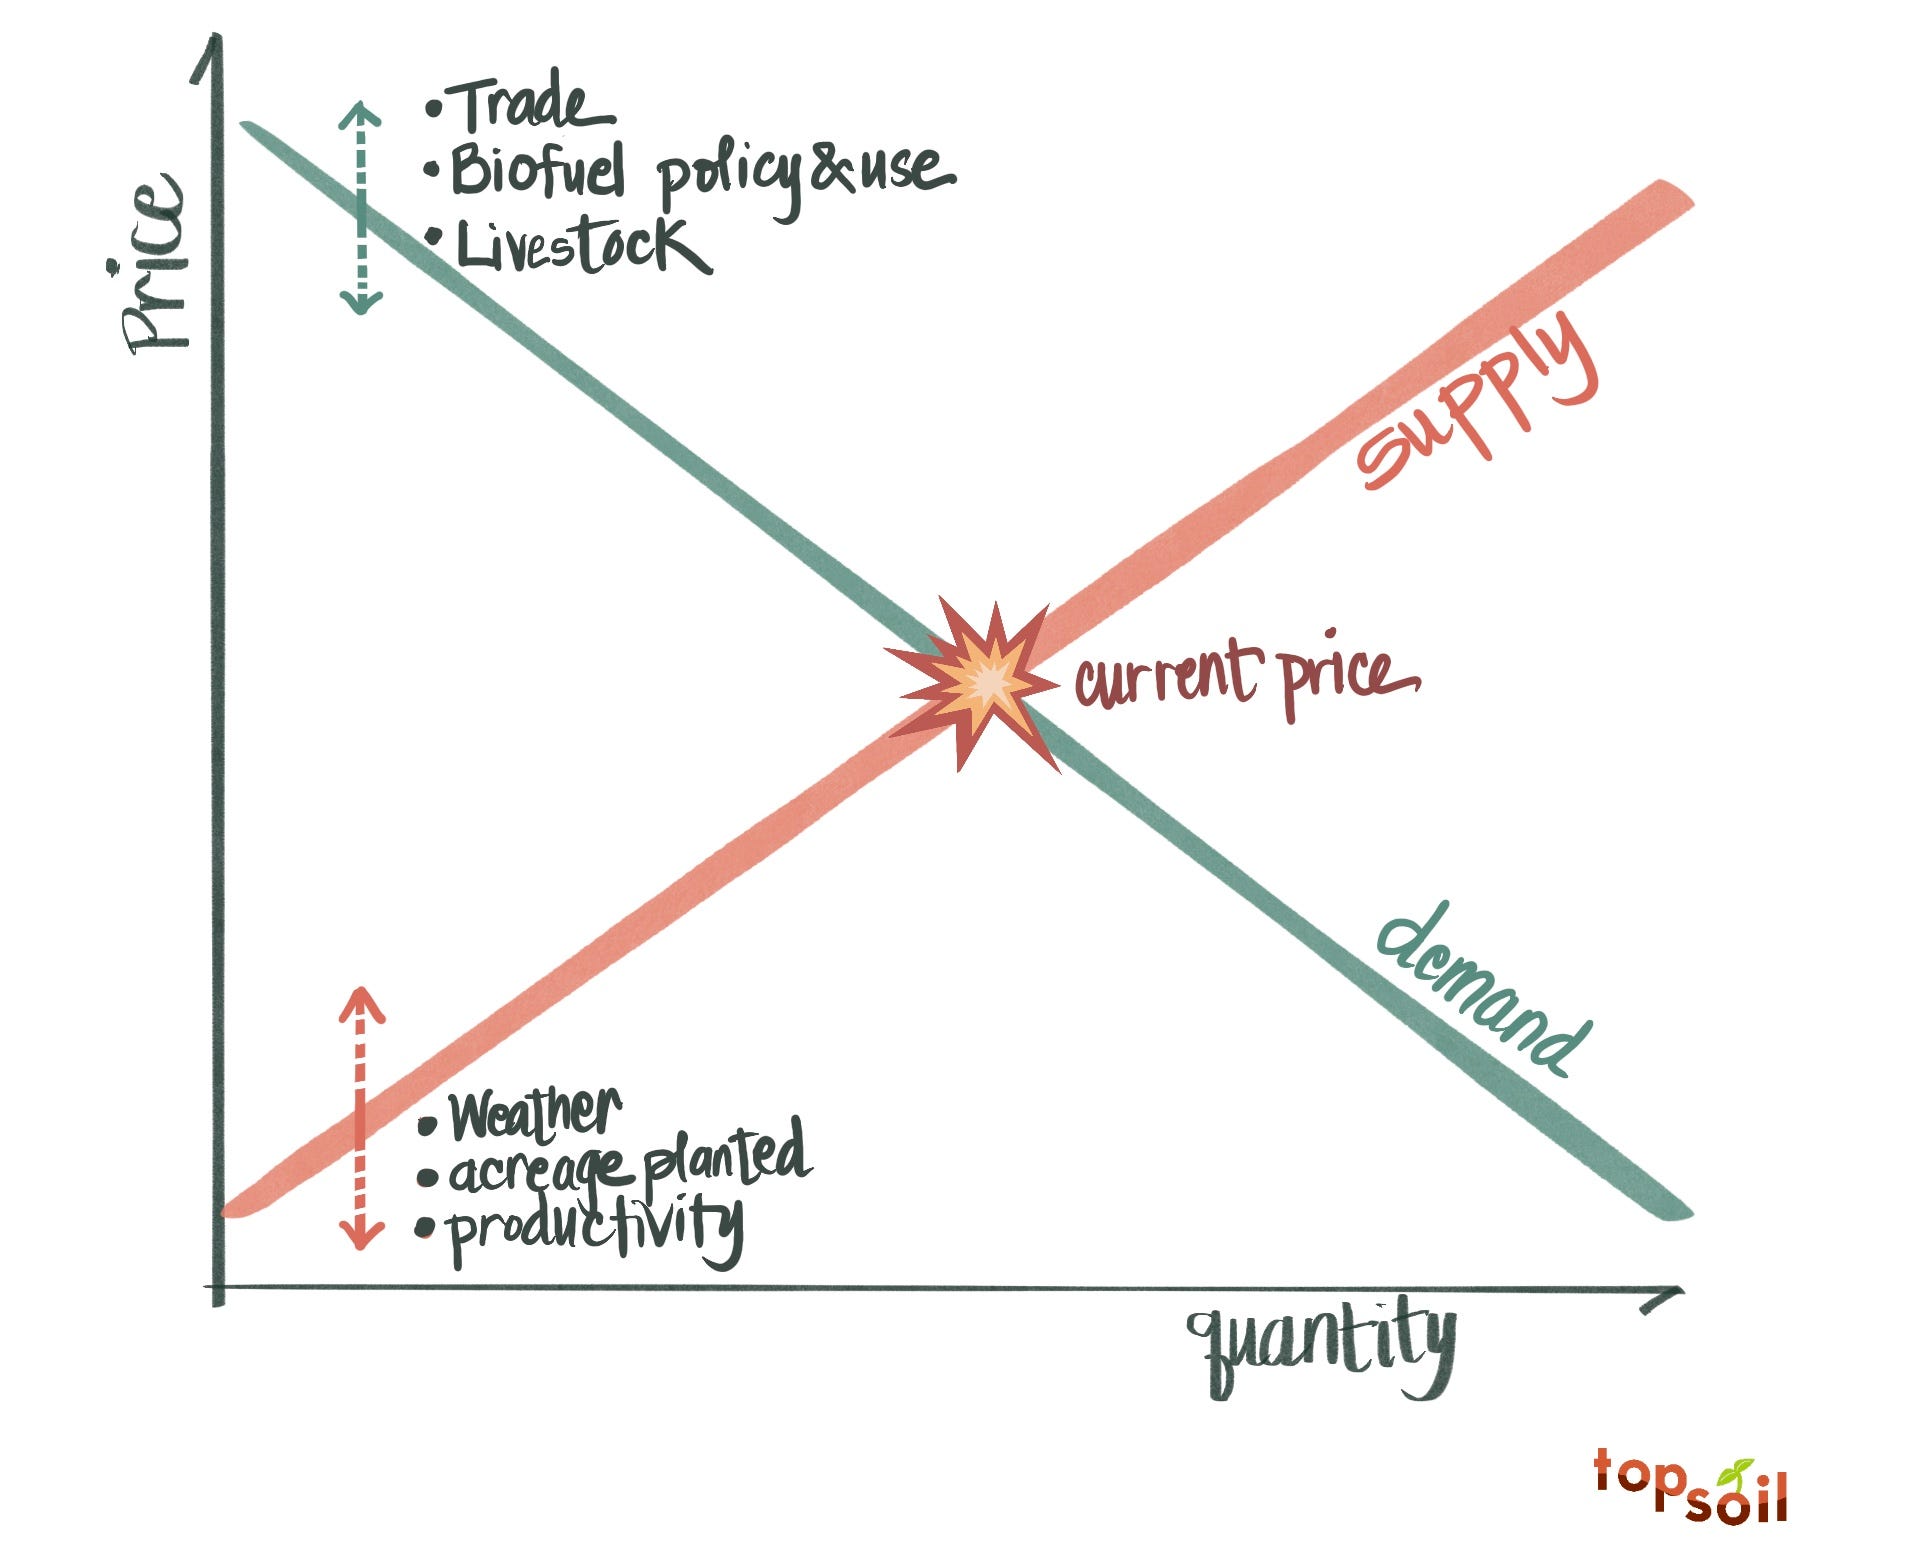
In previous editions, we covered supply, or how much crop is produced. We also covered demand, or how all the crops get used. Now, put the two together and where they meet 💥 – that’s price.
If everything stays the same while supply goes up, prices will go down. If demand goes up, prices will also go up.
Obviously, the real world is a little more complex than a freshman econ class. But considering where any given commodity comes from and where it goes is a helpful starting point.
Sources and uses: real life supply and demand
Let’s look at recent data for corn:

Starting on the left hand side, let’s focus on the yellow flows into “Supply.” We can see that corn in the US is from three sources: the stored corn from last year (beginning stocks), new corn grown this year (production), and a very small amount of imported corn.
The lion’s share is corn grown this season, which is shaped by:
Weather. Most of the corn in the US is grown without irrigation (it is “rain-fed”), so precipitation at the right time of year is critical. Droughts, which are becoming more frequent, can lower supply. Beyond enough rain, there are many other kinds of weather that can harm a crop. Late freezes. Golf ball sized hail. Strong winds. Derechos. Conditions that foster disease and insects. The list goes on and on.
Acreage planted. In 2024, there were over 90 million acres of corn planted in the US, producing about a third of the world’s corn. The total acreage is the sum of hundreds of thousands of farmers making individual decisions on how much to plant. Each of those decisions may be influenced by land prices, by competing uses for land, by agronomic decisions like crop rotations, and by projected commodity prices.
Productivity. Over the past 80 years, corn yields per acre have increased over 500%. Improvements to plant breeding, management practices and new technologies have allowed each acre to produce more.
Agricultural policy like crop insurance, price supports and even direct subsidies (like the $10B in direct payments to farmers passed this week) increase supply as the US government and taxpayers help cushion some of the downside risks of farming.
Input availability. There are several inputs farmers need to produce a crop: seed, equipment, energy, land, fertilizer and crop protection to name a few. Supply chain issues and rising interest rates can make inputs more costly or difficult to get.
Now let’s look at the right side of the chart to see where that corn goes. These are factors that shape demand, which will influence price:
Biofuel Policy & Use: In the early 2000’s, ethanol was a negligible use for corn. After 2005 when the Renewable Fuel Standard was established, ethanol and other biofuels (like soy biodiesel) exploded in growth. The price of energy impacts not only farms’ supply as an input, but also demand. Today, there are several brewing headlines on biofuels: increasing interest in Sustainable Aviation Fuel; the 45Z Clean Fuel Production Credit which will likely further incentivize biofuels; and the year-round E15 exception to allow fuel blended with 15% ethanol to be sold year-round (today 10% ethanol is the standard with 15% being sold only in summer months).
Livestock: A large portion of corn is used directly for animal feed. Dried distillers grains, a byproduct of ethanol production, is also used as feed. As a result, the number of livestock in the world influences the price of many commodities and vice versa. Demographic shifts like consumers’ preferences for meat and dairy and per capita income influence the number of livestock. In recent years, diseases have had a horrifying impact. From 2018-2019 one in every four pigs in the world died from African Swine Fever. Today, it is concerning that the H5N1 strain of avian flu has killed over 280 million birds since 2021. This strain of avian flu has now leaped across species to dairy cattle, hogs, and humans.
Trade: Corn is less sensitive to trade than soybeans (below), but trade is still a big deal because of the share of the crop that goes into export markets. When trade is hindered, by tariffs, embargoes, or all out trade war, demand suffers. When new trade agreements are brokered and new markets open up, demand increases.
Currency also impacts demand since commodities are priced in US dollars. When the dollar is stronger, commodities become more costly to foreign buyers, which can weaken demand.
Global Production: The flow chart above covers US-grown corn. If the amount of grain grown in other parts of the world goes up (like a record Brazilian soybean crop), this can reduce price. On the flip side, if wars, geopolitical conflict, or disasters interfere with crop production, prices rise.
We can use the same approach to look at soybeans. Comparing the soybean chart to the corn chart, you can see that a greater portion of soybeans are exported, meaning that the price for soybeans will be more sensitive to disruptions in trade. Of particular note heading into 2025, at least 20% of US soybeans are exported to China.

Weather, tariffs near and far, billions in subsidies, and changes in renewable fuel policy – I guarantee that this framework also works as a conversation starter to spice up any holiday gathering this winter!
So what’s a farmer to do?
Given that prices are made up of decisions by hundreds of thousands of individuals buying and selling in a market, and that a single farmer can’t control price by themselves, what’s a farmer to do?
In years of low prices, like today, there are two main strategies:
“Tighten the belt.” Farmers cut costs or defer purchases to a later time.
“Bushel your way out of low prices.” The thing about growing a commodity is that revenue is a simple math equation: price multiplied by volume. If price is down, volume needs to go up to make up for lost revenue. This results in farmers aiming to “bushel their way out” or “yield their way out” of low prices – by producing more.
In the long run, farmers have, and will continue to, deploy other creative strategies. Things like getting bigger to increase purchasing power, or taking on an off-farm job or raising livestock to diversify revenue. One thing I will be watching with curiosity is if there is more crop diversification beyond the major commodity crops on the horizon.
On the flip side, when corn prices were getting close to all time highs in 2021, I heard a farmer grumbling that crop prices were getting too darn high.
“Too high?!” I asked, a little baffled. “How could that be a problem?”
His answer was that every company that sells to farmers sees the prices that farmers get for their crops. When the input companies see sky high crop prices, they in turn ratchet their input prices higher. And when grain prices eventually fall back to Earth, the input companies are loath to decrease the prices they charge the farmer. The farmer is then in a bind – less money is coming in and costs remaining stubbornly high.
Standing here as we close out 2024, that farmer was pretty accurate in his assessment of how things would play out.
Ultimately, whether crop prices are high or low, there are reverberations up and down the value chain. High crop prices drive high prices for land and inputs and a wave of new investment in the agriculture sector. Low crop prices – like we see today – trigger layoffs across the sector, companies quietly shutting their doors, and farmers sharpening their management skills.
In either case, if history is any indicator, prices are cyclical and what has been will come again.
Topsoil is handcrafted just for you by Ariel Patton. Complete sources can be found here. All views expressed and any errors in this newsletter are my own.
How did you feel about this monthly edition of Topsoil? Click below to let me know!
Should I interpret the "ending stocks" to be growers putting away their yield for next year's supply? If so it looks like farmers stored significantly more corn and soybean this year!
Hi Ariel,
As always, incredible analysis! I read the piece on the go so I might have missed it, but I'd love to hear your thoughts on how storage availability influences the decisions growers have to make in times like these. Growers betting on futures without having to use complex financial instruments, using instead their own physical goods.
Maybe an idea for a future post? 😉